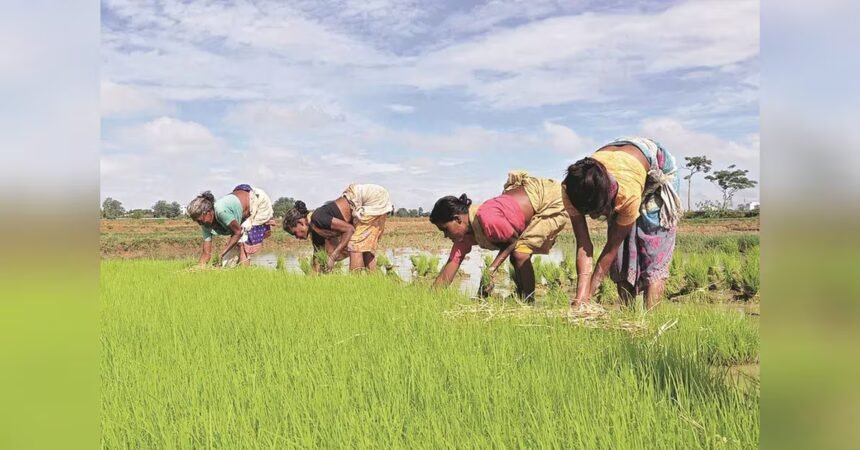
The difference between the area covered under kharif crops this season and the corresponding period last year narrowed further to 4.7 per cent during the week ended July 24 as the southwest monsoon continued its laboured run across the country.
In some parts of western India, particularly in states such as Gujarat, heavy rains caused flooding, which should further aid the sowing of kharif crops once the waters recede.
Gaps in the area under all crops—oilseeds, pulses, soybean, groundnut, urad, moong and maize—narrowed compared to the previous week.
Overall, until July 24, 2026, kharif crops had been sown in around 78.73 million hectares, which was 4.7 per cent lower than the area covered during the same period last year.
For the whole season, kharif crops are sown in around 110.44 million hectares, meaning that until July 24, sowing had been completed in around 71.28 per cent of the normal area.
All eyes will now be on the southwest monsoon in August, which will determine not only the course of further sowing but also the condition of the already sown crops. Any significant break in rains or prolonged dry spells in areas where the crop has been sown and lacks adequate irrigation facilities could be detrimental to the crop’s health and final yields.
July and August are the two most important months for the southwest monsoon, which brings the maximum amount of rainfall.
Meanwhile, data also showed that overall, water levels in the 166 reservoirs as of July 23, 2026, were lower than last year’s level but higher than the 10-year average.
Kharif Sowing As on July 24, 2026 (in million hectares)
|
Crops |
Normal Area |
2026 |
2025 |
% Change* |
|
Paddy |
41.2 |
23.44 |
24.06 |
-2.6 |
|
Pulses |
12.96 |
8.45 |
9.16 |
-7.8 |
|
Arhar |
4.43 |
3.11 |
3.52 |
-11.6 |
|
Urad |
2.96 |
1.86 |
1.72 |
8.1 |
|
Moong |
3.54 |
2.68 |
2.83 |
-5.3 |
|
Coarse Cereals |
18.26 |
14.22 |
16.14 |
-11.9 |
|
Maize |
8.07 |
7.79 |
8.61 |
-9.5 |
|
Oilseeds |
20 |
16.35 |
16.7 |
-2.1 |
|
Soybean |
12.87 |
11.36 |
11.72 |
-3.1 |
|
Groundnut |
4.67 |
4.02 |
4.07 |
-1.2 |
|
Sugarcane |
5.42 |
5.75 |
5.67 |
1.4 |
|
Cotton |
12.55 |
9.87 |
10.27 |
-3.9 |
|
Total |
110.44 |
78.73 |
82.61 |
-4.7 |
* From last year
NOTE: Total might not match as it is only of broad crop categories
Source: Ministry of Agriculture
Monsoon so far from (June 1 to July 26, 2026)
|
Region |
Actual* |
Normal* |
% Departure |
|
East & NE India |
489.6 |
689.8 |
-29 |
|
North-West India |
230.2 |
249.6 |
-8 |
|
Central India |
422.1 |
436.9 |
-3 |
|
South Peninsula |
237.9 |
333.1 |
-29 |
|
All India |
337.7 |
399.2 |
-15 |
NOTE: Decimals have been rounded off
*in millimeters
Source: India Metereological Department (IMD)